

Data Center Project Finance & Development: Commercial Structuring, Power Constraints and Bankability
In Brief
AI is increasing demand for data centre capacity and power infrastructure. Goldman Sachs sizes the 2026–2031 AI buildout at roughly $7.6 trillion across compute, data centres and power.
This article examines the key factors underlying this growth, focusing on grid access, tenancy structures, geographic concentration, and their implications for developers and lenders. It also considers the constraints on new capacity and the factors determining data centre project bankability.
Introduction to Physical Infrastructure of the Digital Economy
Artificial intelligence, cloud computing, streaming services, and digital finance all depend on physical data centre infrastructure. As demand for computing capacity increases, the International Energy Agency (IEA) projects that global data centre electricity consumption will more than double to 945 TWh by 2030, driven in part by the growth of AI workloads.
However, this expansion is highly concentrated geographically:
- Africa currently accounts for less than 2% of global colocation capacity with more than half concentrated in South Africa despite requiring an estimated 1,000 MW of new capacity to meet baseline regional demand.
- Northern Virginia, the world’s largest data center market, surpassed 4,900 MW of total inventory, maintaining a historical vacancy rate below 1% (Kassouwi, 2025).
Historically, increases in computing demand were accompanied by relatively limited growth in data centre energy consumption. Masanet et al. (2020) found that between 2010 and 2018, global data centre compute instances increased by 550%, while energy consumption increased by only 6%, reflecting gains in efficiency and cloud consolidation. AI workloads are now increasing power requirements per unit of computing capacity, making power availability and contractual structures increasingly important to project feasibility.
Data centre operators generate revenue by providing computing capacity under Service Level Agreements (SLAs) that specify availability and performance requirements. Revenue is closely linked to the amount of IT capacity contracted, typically measured in megawatts (MW). While legacy enterprise server racks consumed 5–15 kW, high-density AI deployments now require 40–100+ kW per rack (Digi Power X Inc., 2026).
Origins and Evolution from Mainframes to Ultra-High-Density AI
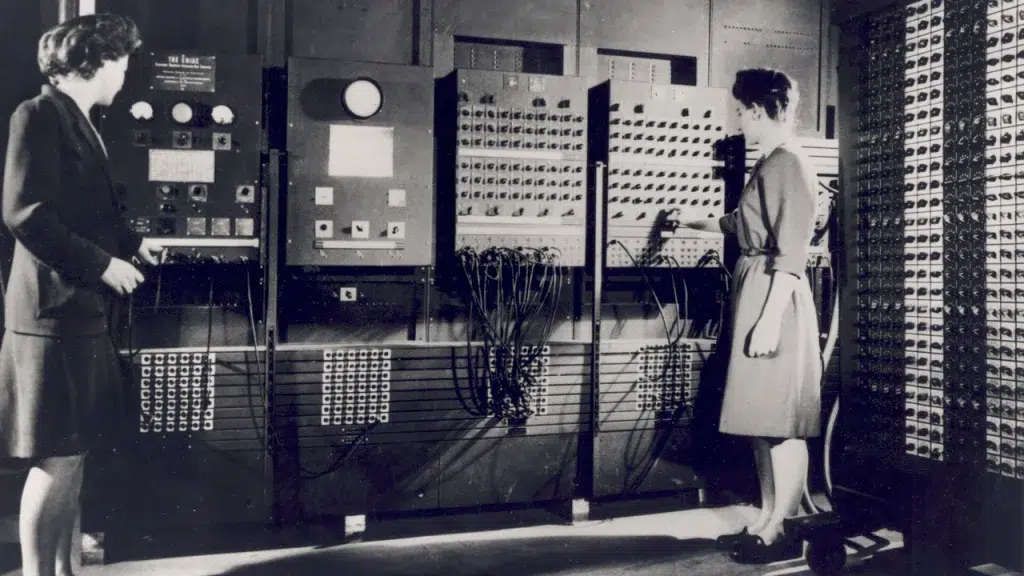
The physical infrastructure supporting computing predates the commercial internet by several decades. One early example was ENIAC (Electronic Numerical Integrator and Computer), completed in 1945 at the University of Pennsylvania. The machine was so massive that it required a dedicated, climate-controlled facility constructed around its hardware.
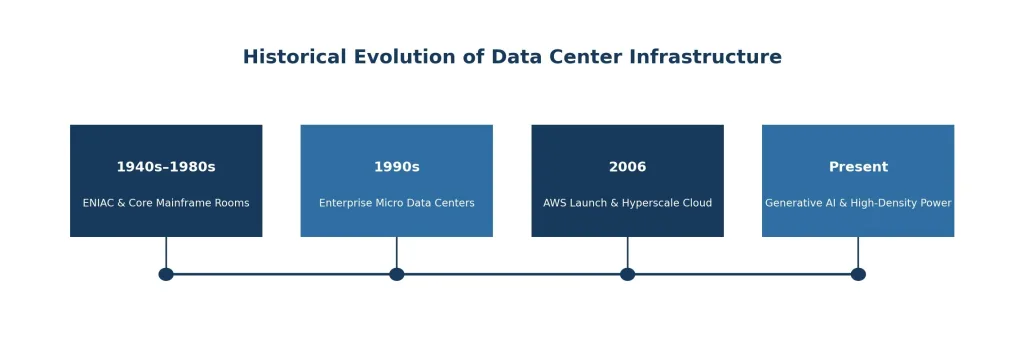
The industry’s structural turning point occurred in 2006 when Amazon Web Services (AWS) commercialized on-demand cloud computing. Delivering infrastructure-as-a-service required a new asset class: the hyperscale data center. The ongoing AI expansion represents the latest wave in this evolution, requiring fundamentally different power, cooling, and capital deployment strategies.
For a broader perspective on how technical parameters influence transaction documentation, read GIA’s Guide to Infrastructure Project Structuring.
Types: Hyperscale, Colocation and Edge
Data centers are categorized into three primary typologies based on tenant profile, scale, revenue model, and commercial risk distribution:
1. Hyperscale
Hyperscale data centers are single-tenant facilities built for major cloud or AI platforms such as AWS, Microsoft Azure, Google Cloud, Meta, or Oracle (Hewlett Packard Enterprise, n.d.).
- Control: Single-tenant control where design specifications are dictated by the occupier.
- Pre-Leasing: Facilities are typically pre-leased in full under long-term contracts prior to construction.
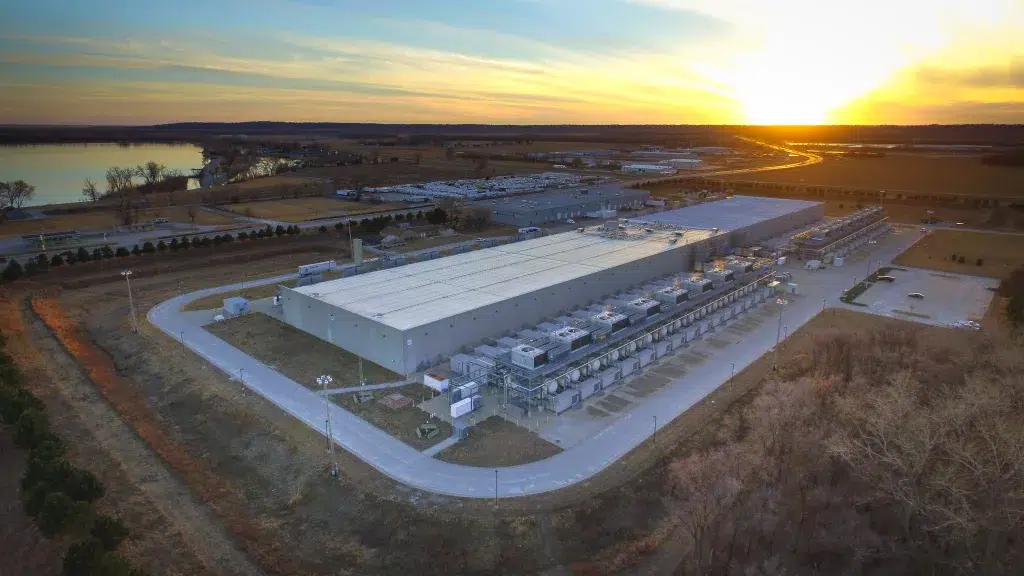
- Capital Intensity: The Stargate campus in Saline, Michigan, developed by Related Digital for Oracle and OpenAI, illustrates this scale: site development represents a $16 billion investment, with an additional $30 billion to $40 billion committed to specialized computing hardware (Related Digital, 2026).
2. Colocation
Colocation data centres are developed and operated by specialist providers that lease physical space, electrical capacity, and cooling infrastructure to multiple independent tenants.
- Demand Aggregation: The developer pools demand from telecom operators, financial institutions, internet service providers (ISPs), and enterprise platforms.
- Emerging Markets Dominance: Colocation is the dominant structure in emerging economies. For example, Raxio Group operates a carrier-neutral colocation platform spanning Uganda, Ethiopia, Mozambique, the Democratic Republic of Congo, Côte d’Ivoire, Tanzania, and Angola.
3. Edge
Edge data centres are smaller facilities located closer to end-users to reduce network latency.
- Proximity & Latency: Applications requiring instant processing power (e.g., automated industrial systems, local content delivery) require computing near consumption.
- Frontier Deployments: In frontier markets, edge infrastructure serves immediate metro demand. For instance, the International Finance Corporation (IFC)-financed Raxio initiative encompasses ten metro-edge facilities with a total combined capacity of 13.5 MW, customized to individual national markets.
SEE REVENUE MODEL, TENANTS, RISK BEARER BY ASSET TYPE
| Typology | Typical Tenant Profile | Primary Revenue Model | Demand Risk Bearer | Average IT Capacity |
|---|---|---|---|---|
| Hyperscale | Single Cloud / AI Operator (AWS, Azure, Oracle) | Long-term pre-let, take-or-pay capacity leases | Tenant / Offtaker | 50 MW to 200+ MW |
| Colocation | Telcos, Banks, Enterprises, Cloud Nodes | Multi-tenant leases per kW of reserved IT load | Developer / Operator | 10 MW to 40 MW |
| Edge | Local Enterprises, Content Networks, ISPs | Multi-tenant, shorter-term rack & power leases | Developer / Operator | 1 MW to 10 MW |
How Do Tier III Reliability Standards Function as a Bankability Tool?
To verify operational resilience for institutional investors and debt providers, the industry relies on the Uptime Institute Tier Classification System:
- Tier I: Basic capacity with a single, non-redundant power and cooling distribution path.
- Tier II: Redundant component capacity (N+1) with a single distribution path.
- Tier III (Concurrently Maintainable): Features multiple power and cooling distribution paths, ensuring any single component or path can be removed from service for maintenance without interrupting operations.
- Tier IV (Fault Tolerant): Multiple active distribution paths with fully duplicated, compartmentalized systems to withstand unplanned system failures.
CRITICAL BANKABILITY PRINCIPLE: THE AUDIT REQUIREMENT
Under Uptime Institute rules, a data center facility cannot self-certify. Tier III status requires independent third-party design and operational audit verification by accredited Uptime Institute consultants.
Tier III represents the commercial point of convergence between operational resilience and capital efficiency. Because most institutional tenants require concurrent maintainability as a prerequisite for lease execution, Tier III certification functions as an essential bankability tool. It provides lenders and equity partners with independent verification that the facility meets global engineering benchmarks (Uptime Institute, 2023).
Why is Power Availability the Primary Bottleneck in Data Center Site Selection?
Grid Power Constraints and the PPA Solution
Grid power access is the main site selection criteria for modern digital infrastructure. While land, fiber routes, and municipal permits can be secured across multiple alternative locations, high-voltage electricity is constrained by grid capacity (Jones Lang LaSalle, 2026).
Across major data centre markets, average grid connection times now exceed four years, making access to power a key constraint in site selection. Grid interconnection queues in the most important US data centre markets now run eight to 12 years – two to three generations of GPU hardware (Goldman Sachs, 2026).
Development is therefore expanding beyond established hubs: 64% of the 35 GW under construction in North America is located in frontier markets, including West Texas, Tennessee, Wisconsin, and Ohio. These markets offer greater power availability and land supply, with Texas projected to overtake Virginia as the world’s largest data centre market by 2030 (Jones Lang LaSalle, 2026).
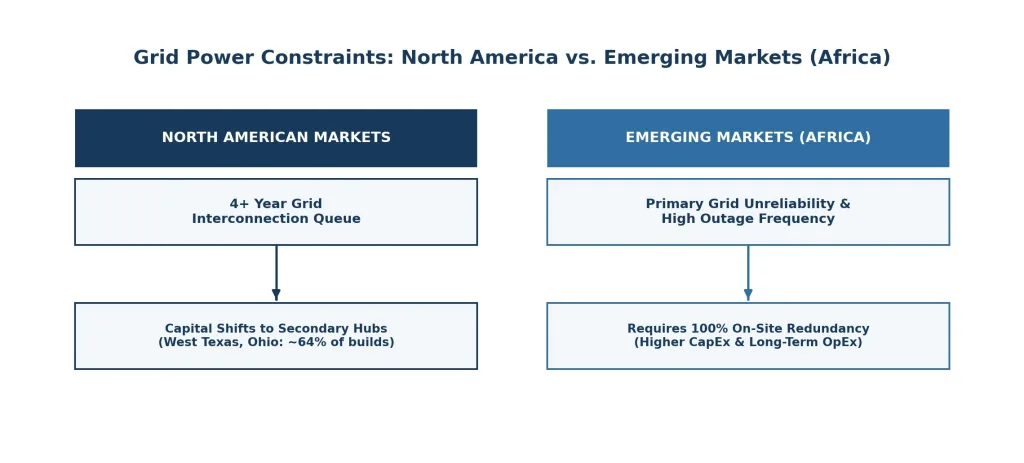
In African markets, the main constraint is often grid reliability rather than connection capacity. Data centre operators may therefore require on-site backup generation, including diesel generators, heavy-fuel engines, or solar microgrids, to maintain operations during grid outages. This increases both initial CapEx and ongoing OpEx (Batson, 2026; Smolaks, 2023).
To reduce power supply risk and meet corporate sustainability requirements, data centre developers increasingly use Power Purchase Agreements (PPAs) to procure electricity from independent power producers (IPPs), including solar, wind, and nuclear generation (U.S. Energy Information Administration, 2024)
Fiber Optic Diversity
Data centres require multiple physically separated fibre routes to reduce the risk of network disruption from a single point of failure. Proximity to major Internet Exchange Points (IXPs) also affects network latency, which is constrained by physical distance.
For detailed risk mitigation strategies across energy supply contracts, review GIA’s briefing on Risk Allocation in Infrastructure Project Finance.
Technical Design Parameters: IT Load, AI Density, and Energy Efficiency Metrics
IT Load Sizing and CapEx Benchmarks
Data centres are primarily sized and valued based on IT Load, defined as the electrical power supplied to computing equipment, rather than gross floor area. Total facility power demand also includes auxiliary loads for cooling, power distribution, and other supporting systems (Uptime Institute, 2024).
- CapEx Benchmark: Electrical infrastructure represents approximately 40–45% of overall data center costs, equivalent to around $7 million to $12 million per MW of IT load (GE Vernova, 2024).
- System Redundancy: Redundancy is defined relative to the baseline system requirement (N). An N+1 configuration provides one additional unit beyond the required capacity, while a 2N configuration duplicates the full power and cooling architecture.
High-Density AI & Liquid Cooling Transition
AI deployments are driving rack densities from traditional levels toward 40 kW and above, with densities exceeding 100 kW becoming increasingly common. This high power concentration is driving a transition toward liquid cooling, as traditional air cooling cannot effectively handle the heat generated by high-density AI workloads (Vertiv, 2024).
Power Usage Effectiveness (PUE) Formula
Energy efficiency is measured using Power Usage Effectiveness (PUE), defined as the ratio of total energy consumed by the facility to energy consumed by IT equipment:
PUE = Total Facility Energy Consumption ÷ IT Equipment Energy Consumption
An ideal PUE score is 1.0 (where 100% of energy powers computing hardware). Modern hyperscale facilities achieve annual average PUEs between 1.15 and 1.25, whereas facilities in hot climates or legacy builds average 1.5 to 1.8. Lower PUE scores directly reduce operating costs, serving as a key competitive advantage when negotiating tenant power passthrough terms (Uptime Institute, 2024).
Core Commercial Structures and Project Finance Mechanics:
Revenue Models and Risk Allocation
Project feasibility depends in part on how capacity leases allocate demand and revenue risk between the developer and the tenant:
- Multi-Tenant Colocation Structure: The developer leases capacity incrementally across multiple enterprise tenants. Demand risk remains with the developer, but counterparty credit risk is spread across a broader tenant base.
- Single-Tenant Take-or-Pay Structure: The tenant contracts the facility’s entire capacity under a long-term contract (10–15 years). The tenant pays for reserved capacity regardless of actual electricity utilization, transferring demand risk to the off-taker (Kearney, 2024).
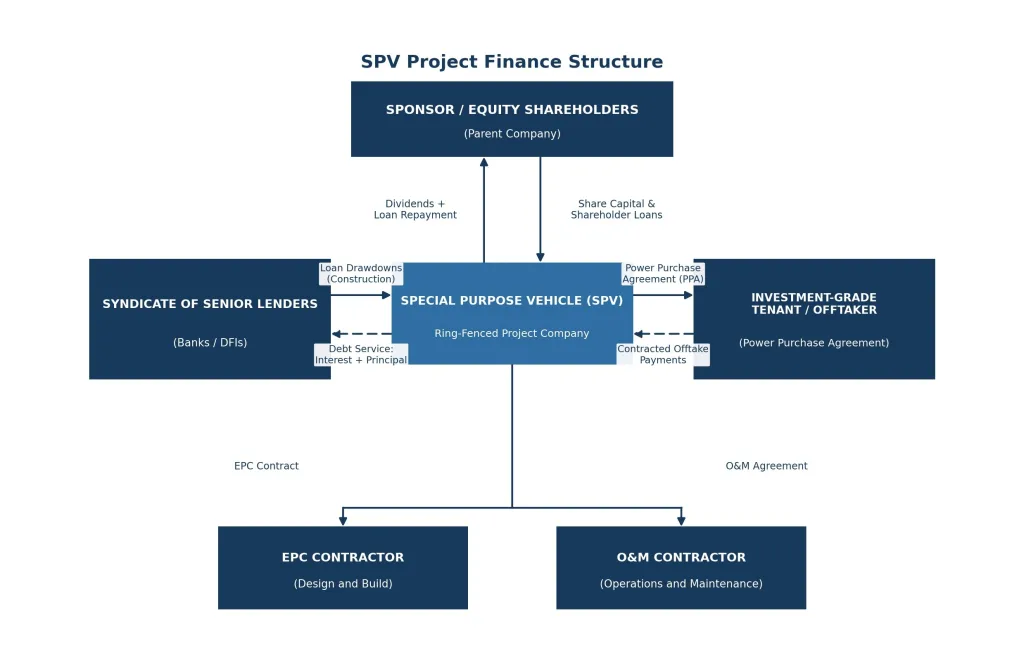
Non-Recourse Project Finance & SPV Structure
AI-related issuance from hyperscalers and infrastructure operators reached approximately $121 billion in 2025, or 6.6% of the $1.83 trillion US investment-grade market. Goldman Sachs projects that share rising toward 20% in 2026. On or off balance sheet, data center assets can be financed using non-recourse project finance structures. The asset is held within a legally ring-fenced Special Purpose Vehicle (SPV), isolating the parent sponsor from direct liabilities.
As established in foundational corporate finance research by Gorton & Souleles (2006), the primary structural advantage of an SPV is bankruptcy remoteness. By offloading project risks into an independent legal entity, debt pricing is underwritten based strictly on the cash flows generated by the underlying project contracts rather than the sponsor’s corporate balance sheet.
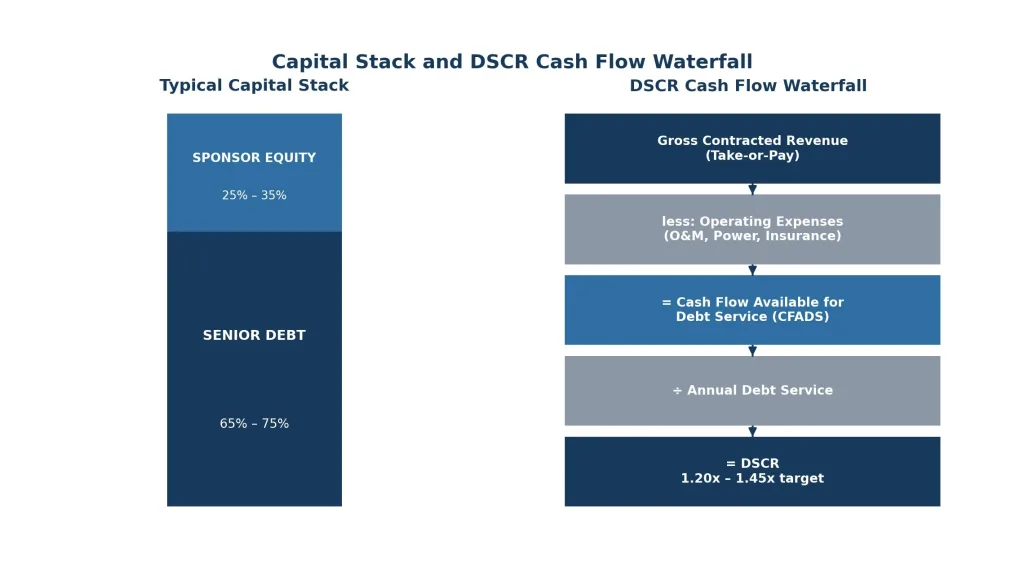
Lenders underwrite debt sizing based on two variables:
- Contractual Revenue Certainty: The proportion of total capacity secured under executed, long-term pre-leases.
- Counterparty Creditworthiness: The credit rating of the underlying off-taker.
Capital Structure & Debt Sizing Benchmarks
- Debt-to-Equity Ratio: Colocation project-finance structures can typically support approximately 60%–70% debt financing, with the balance funded through sponsor equity.
Debt Service Coverage Ratio (DSCR): Lenders evaluate the ratio of Cash Flow Available for Debt Service (CFADS) to annual debt payments:
DSCR = Cash Flow Available for Debt Service (CFADS) ÷ Annual Debt Service
- Hyperscale Project-Finance Builds: DSCR requirements can range from approximately 1.05x to 1.25x, reflecting the greater revenue certainty associated with contracted hyperscale capacity.
- Colocation Builds: DSCR requirements are typically around 1.25x or higher, providing additional protection against lease-up and occupancy risks. (Norton Rose Fulbright, 2021; Newmark, 2023)
Institutional appetite for project-financed digital infrastructure is demonstrated by major global transactions, such as Blackstone’s $7 billion joint venture with Digital Realty to fund 500 MW of hyperscale capacity across Frankfurt, Paris, and Northern Virginia.
For a detailed breakdown of deal negotiation parameters, see our insight on How to Navigate PPA’s and Select The Right OffTaker. To see how GIA structured equity and debt for similar complex builds, explore our How to Identify and Secure Finance for Renewable Energy Projects.
Frequently Asked Questions (Data Center Development & Financing)
Q1: What is the primary difference between hyperscale and colocation project finance?
A: Hyperscale project finance relies on long-term, take-or-pay leases signed by a single, highly rated cloud provider prior to construction, transferring demand risk to the tenant. Colocation project finance involves multi-tenant leasing structures where the developer retains demand and lease-up risk, requiring higher equity buffers and higher target DSCR thresholds from senior lenders.
Q2: How do grid interconnection delays impact data center bankability?
A: Extended grid interconnection queues (often exceeding 4 years in primary hubs) delay project commissioning and revenue generation. In project finance, delays increase debt carrying costs and risk violating pre-lease milestone covenants. Developers mitigate this by securing off-grid Power Purchase Agreements (PPAs) or selecting sites in secondary energy markets.
Q3: What DSCR metrics do senior debt lenders require for data center SPVs?
A: Lenders typically require a minimum Debt Service Coverage Ratio (DSCR) for data center projects, with requirements varying according to contractual revenue certainty, tenant credit quality, and lease-up risk. Fully pre-leased hyperscale assets with investment-grade tenants generally support lower DSCR requirements, while multi-tenant colocation or merchant facilities typically require higher coverage to absorb occupancy and operating risks
Transaction Advisory Services
Structuring a Bankable Infrastructure Asset?
Global Infrastructure Advisors provides lender-ready financial modeling, commercial risk structuring, and debt & equity advisory for data center and energy infrastructure mandates.
Talk to our team
If you are considering a project-financed infrastructure opportunity and need support on commercial structuring, lender-ready financial modelling, or bid execution, get in touch with our team at info@gi-advisors.com.
Stay ahead of the curve
Follow us on LinkedIn to receive regular updates on how to successfully develop large-scale infrastructure.
References
- Batson, A. (2026, February 17). North America data center report year-end 2025. JLL.
- Blackstone Real Estate. (2023). Blackstone and Digital Realty form $7 billion joint venture to develop hyperscale data center campuses [Press release].
- Digi Power X Inc. (2026, May 4). Data center colocation and master services agreement between Digi Power X Inc. and Cerebras Systems Inc. U.S. Securities and Exchange Commission. SEC filing
- GE Vernova. (2024). Data center grid solutions. GE Vernova.
- Gorton, G. B., & Souleles, N. S. (2006). Special purpose vehicles and securitization (NBER Working Paper No. 11190). National Bureau of Economic Research. https://www.nber.org/papers/w11190
- Global Infrastructure Advisors Transaction Team. (2026). Infrastructure project structuring & financial modelling benchmarks (2024–2026 deal bank) [Technical report].
- Goldman Sachs Investment Banking. (2026). Harnessing AI for the real economy.
- Hewlett Packard Enterprise. (n.d.). What is an enterprise data center? HPE
- International Energy Agency. (2024). Electricity 2024: Analysis and forecast to 2026. https://www.iea.org/
- International Finance Corporation. (2023). Expanding digital infrastructure in emerging markets: Raxio platform investment disclosure. World Bank Group. https://www.ifc.org/
- Jones Lang LaSalle. (2026a). 2026 global data center outlook. https://www.jll.com/en-us/insights/market-outlook/data-center-outlook
- Jones Lang LaSalle. (2026b). North America data center report: Year-end 2025. https://www.jll.com/en-us/insights/market-dynamics/north-america-data-centers
- Kassouwi, I. K. (2025, November 4). Digital Realty expands African footprint with new data center in Ghana. Ecofin Agency.
- Kearney, L. (2024, May 7). Duke Energy seeks take-or-pay power contracts for data centers. Reuters. Reuters article
- Masanet, E., Shehabi, A., Ramakrishnan, N., Liang, J., Fan, X., & Koomey, J. (2020). Recalibrating global data center energy-use estimates. Science, 367(6481), 984–986. https://doi.org/10.1126/science.aba3758
- Newmark. (2023). 2023 U.S. data center market overview. Newmark. Newmark – 2023 U.S. Data Center Market Overview
- Norton Rose Fulbright. (2021, June). Lender considerations on data centre financings in Europe. Norton Rose Fulbright. Norton Rose Fulbright – Lender considerations on data centre financings in Europe
- Rand, J., Manderlink, N., Zhang, S., Talley, C., Gorman, W., Wiser, R. H., Seel, J., Kemp, J. M., Jeong, S., & Kahrl, F. (2025). Queued up: 2025 edition, characteristics of power plants seeking transmission interconnection as of the end of 2024. Lawrence Berkeley National Laboratory.
- Related Digital. (2026, April 24). Related Digital announces financing for $16 billion Oracle data center project in Saline Township, Michigan. Related Digital
- Smolaks, M. (2023, May 17). The effects of a failing power grid in South Africa. Uptime Institute.
- Uptime Institute. (2023). Tier standard: Topology. Uptime Institute Professional Services. https://uptimeinstitute.com/
- Uptime Institute. (2024). Uptime Institute global data center survey 2024. Uptime Institute. Uptime Institute Global Data Center Survey 2024
- U.S. Energy Information Administration. (2024, October 1). Data center owners turn to nuclear as potential electricity source. EIA – Data Center Owners Turn to Nuclear
- Vertiv – Powering and Cooling AI Factory and Accelerated Computing


